Key Highlights:
- Trend analysis evaluates financial data over time to identify patterns, such as growth, decline, or stability.
- Analyzing trends involves examining the balance sheet (assets, liabilities, equity), income statement (revenue, expenses, profit margins), and cash flow statement (operating, investing, and financing activities)
- Trend analysis uses different approaches to compare financial data. Three primary methods include- Horizontal, Vertical, and Ratio Analysis.
- Trend analysis provides valuable insights for identifying performance drivers, making informed decisions, and spotting potential issues early.
- Arya AI's tools, like the Bank Statement Analyser, can streamline financial analysis, reduce manual effort, and provide accurate insights.
When analyzing a company's financial health, trend analysis is one of the most valuable tools available. Financial statements provide a snapshot of a company’s financial position at a specific moment. However, looking at a single period’s financial statements only provides a snapshot of the company’s financial position at that specific moment.
That’s where trend analysis comes in.
What Is Trend Analysis in Financial Statement Analysis?
Trend analysis involves evaluating financial information over a period, which can range from months to years, to detect uptrends, downtrends, or periods of stagnation. It compares data from financial statements across multiple periods, identifying percentage changes and allowing you to assess whether a company’s profitability, liquidity, or efficiency is improving or declining.
For example, trend analysis helps you determine whether a company’s net profit is increasing, decreasing, or remaining stable over time, making it a critical tool for stakeholders looking to understand long-term business health.
Key Components of Financial Statements for Trend Analysis
To effectively analyze trends in financial statements, it's important to understand the main components of these statements. Each component offers unique insights crucial for a comprehensive analysis.
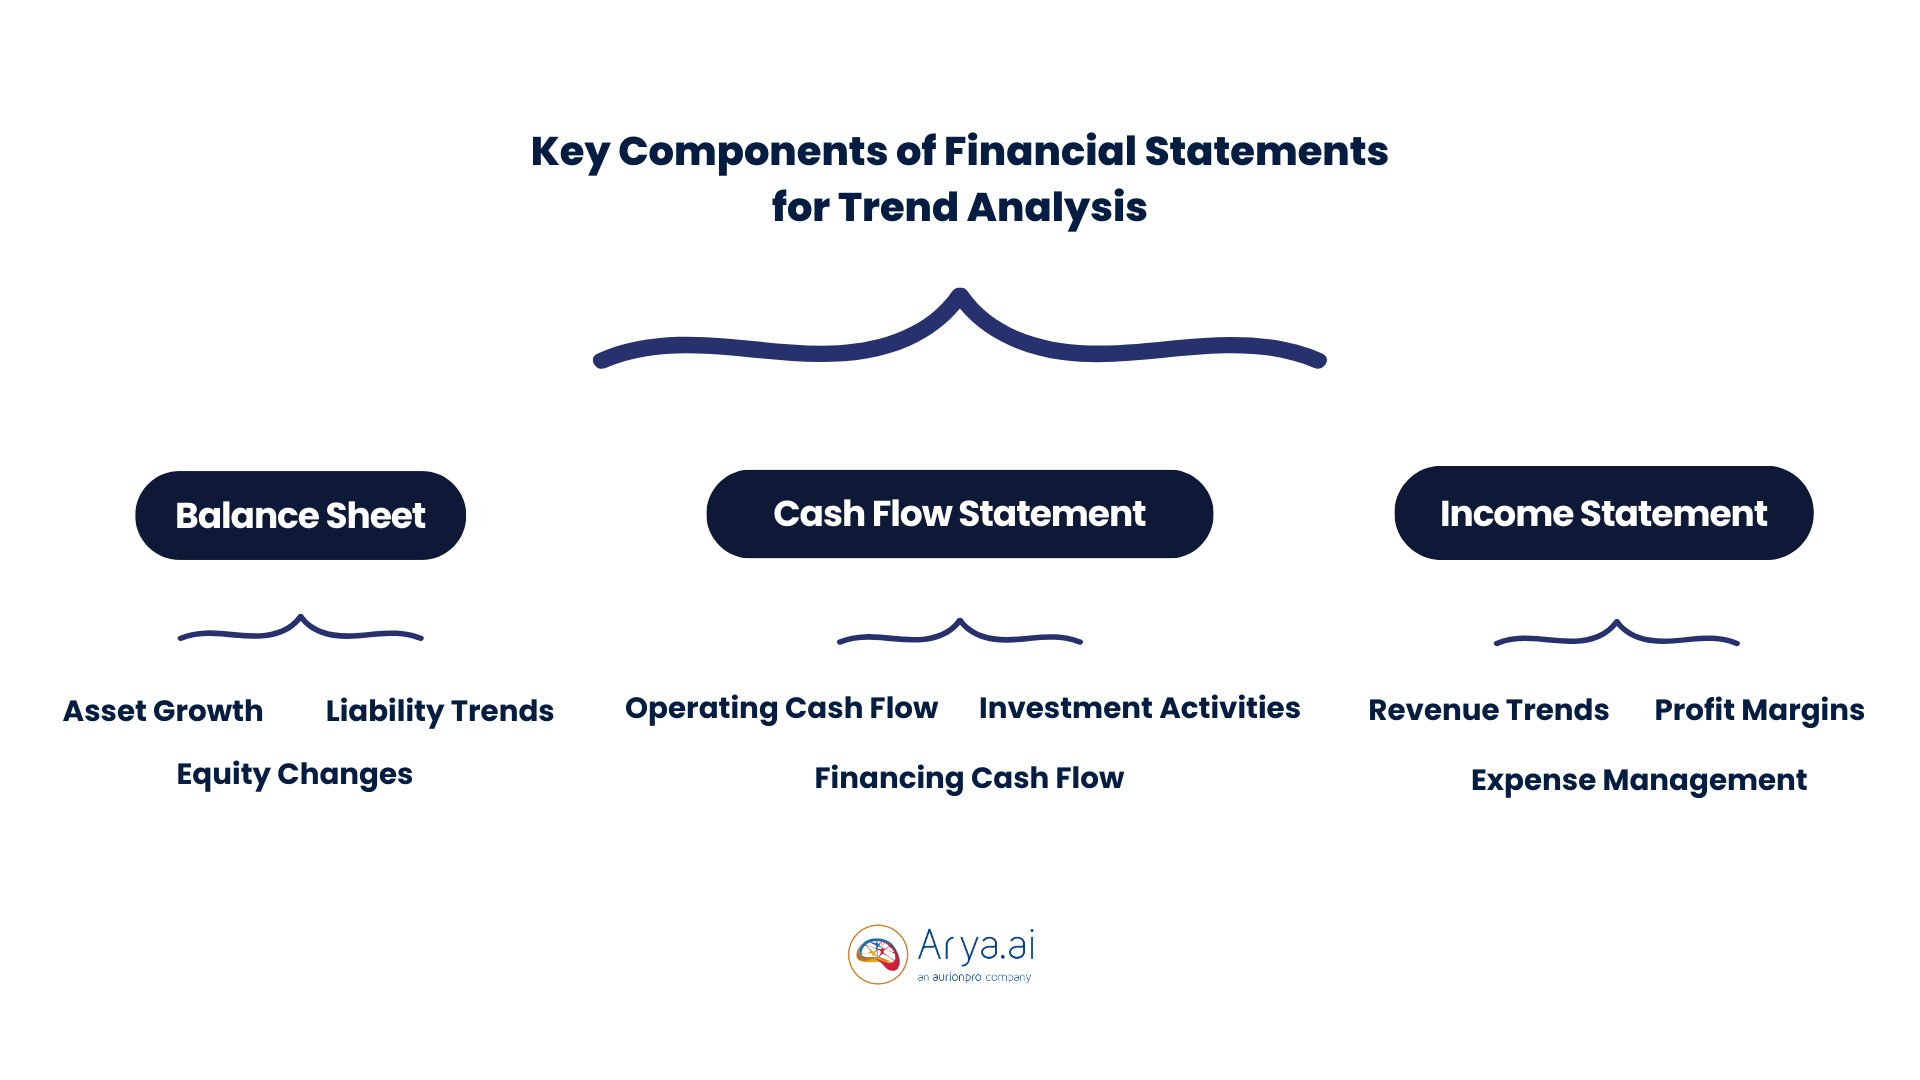
Balance Sheet
The balance sheet provides a snapshot of a company’s financial position at a specific time, detailing assets, liabilities, and equity. Analyzing trends in these areas helps assess a company’s financial stability and ability to manage obligations:
- Asset Growth: Tracking asset trends can indicate whether a company is expanding, investing in new technology, or accumulating unnecessary resources.
- Liability Trends: Identifying whether a company's liabilities are rising or falling can highlight how well it manages debt. A steady increase could signify leveraging opportunities, but it might also suggest financial strain.
- Equity Changes: Changes in equity, especially in retained earnings, can indicate how profits are being reinvested into the company for future growth.
Cash Flow Statement
Often overlooked, the cash flow statement is vital for understanding a company’s liquidity:
- Operating Cash Flow: This shows whether the company’s core operations generate enough cash to sustain the business.
- Investment Activities: Investment in new projects signals future growth but can also drain resources if not managed well.
- Financing Cash Flow: Trends in financing activities, like raising capital or paying down debt, reflect a company’s approach to long-term financial planning.
Income Statement
The income statement, also known as the profit and loss statement, showcases a company’s performance over a set period:
- Revenue Trends: A consistent increase in revenue suggests strong market demand and good business strategy.
- Expense Management: Tracking changes in expenses allows businesses to identify areas for cost-cutting or efficiency improvements.
- Profit Margins: Analyzing profit margins over time provides insight into how well a company converts revenue into profit.
Types of Trend Analysis
Trend analysis uses different approaches to compare financial data. The three most common types are:
1. Horizontal Analysis
This approach involves comparing specific line items over several periods, highlighting growth, decline, or stagnation. For example, if a company's revenue grew from $500,000 to $600,000 in one year, the percentage change is 20%, indicating healthy growth.
2. Vertical Analysis
Vertical analysis evaluates each item in a financial statement as a percentage of a base figure, such as total assets or revenue. This method is useful for comparing companies of different sizes or tracking how a company’s internal components evolve over time.
Consider a company with total sales of $1,000,000 and a cost of goods sold (COGS) of $400,000. In vertical analysis, COGS is expressed as a percentage of total sales:
COGS as Percentage of Sales = ($400,000$ / 1,000,000) × 100 = 40%
This means that for every dollar of sales, 40 cents are spent on goods sold. If another company has sales of $2,000,000 and a COGS of $800,000, its COGS would also be 40%. Despite different sales figures, both companies show a similar cost structure.
3. Ratio Analysis
Ratio analysis examines relationships between various financial statement items to assess profitability, liquidity, and efficiency. Common ratios include the current ratio (current assets ÷ current liabilities) and return on equity (net income ÷ shareholders' equity).
For example-
- Current Ratio
If a company has current assets of $500,000 and current liabilities of $250,000, the current ratio would be 2.0. This means the company has $2 in assets for every $1 of liability, indicating good liquidity.
- Return on Equity (ROE)
If a company’s net income is $200,000 and shareholders' equity is $1,000,000, its ROE would be 0.20 or 20%. This shows that for every dollar of equity, the company generates 20 cents of profit, which can be used to compare the company's profitability against competitors or historical performance.
Benefits of Trend Analysis in Financial Statement Analysis
Using trend analysis provides significant advantages, including:
- Identifying Key Performance Drivers: Trend analysis uncovers growth patterns, reveals revenue fluctuations, and pinpoints cost drivers. By recognizing these trends early, companies can optimize their strategies and allocate resources more effectively.
- Making Informed Decisions: Whether managing a business or considering an investment, trend analysis offers the context needed to make smarter decisions by predicting future performance based on historical data.
- Spotting Potential Issues Early: Trend analysis can help identify potential financial issues, such as declining profit margins, before they become critical.
Challenges of Performing Trend Analysis
Despite its benefits, trend analysis comes with challenges:
- Inconsistent Data: Changes in accounting policies or mergers can lead to inconsistencies in financial data, making comparisons difficult.
- External Factors: Broader economic conditions or industry changes can skew financial trends, making it hard to determine whether a trend is company-specific or industry-wide.
- Overlooking Non-Financial Data: Financial statements don't capture factors like customer satisfaction or market positioning, which are essential to understanding a company’s full picture.
How Arya.AI Can Help with Financial Analysis
Arya AI’s Bank Statement Analyser streamlines financial statement analysis, turning raw financial data into actionable insights.
With multi-format support and anomaly detection, Arya AI can reduce manual effort, speed up analysis, and ensure more accurate assessments. The platform’s ability to identify financial trends makes it an essential tool for financial professionals looking to leverage the power of data in their decision-making.
Conclusion
Trend analysis offers a comprehensive view of a company's financial journey over time to make data-driven decisions. It is an indispensable tool for uncovering the insights needed for long-term success.
Moreover, integrating apps bespoke solutions with Arya AI or plug-and-play apps like bank statement analyzer can enhance your ability to perform thorough financial analysis with greater efficiency and accuracy.
Contact us today to learn more about how Arya.AI can streamline your financial statement analysis.